Good morning, good afternoon.
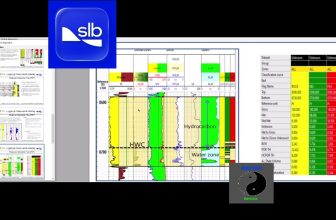
In this video, we are showing simulation of petrophysical data. We are acquired porosity.
We are make some statistics. We are make depth range, the deviation range, and we are simulate the depth.
We assimilate the porosity and water saturation. We have calculated the permeability — log normal distribution and fit.
We transform porosity for normal for the correlation for standard porosity.
We generate standard normal, and we calculate also the permeability along the wells.
We are convert from normal to log normal permeability.
And we ensure also we create some statistical of petrophysical parameters like:
- Porosity histogram
- Permeability histogram
- Water saturation
And also:
Porosity versus permeability crossplot.
And I show you, for example, some data.
We show, for example, the physical data with:
- Porosity versus frequencies
- The permeability distribution
- The water saturation
- And water saturation distribution
- The porosity versus permeability
So this is the typical data.
We need this data to make the statistic of petrophysical data acquired.
We are matching, for example — we have a great correlation between porosity and permeability in wells number one with this trend.
And so we have this kind of simulation.